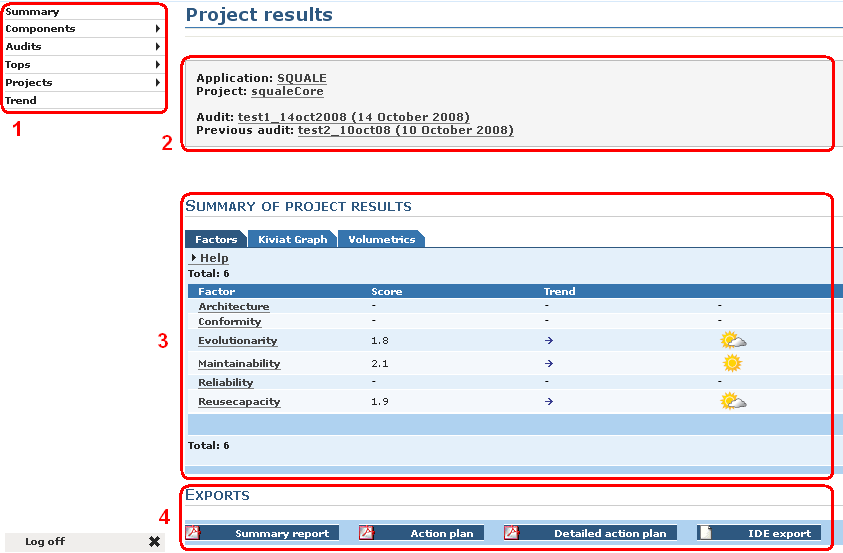

All the project results pages have the same structure :

Let's see the contents of these area.
Left menu
  |
  |-- Summary
  |
  |-- Components
  |     |-- All
  |     `-- Excluded from action plan
  |
  |-- Audits
  |     |-- Successful
  |     |-- Failed
  |     `-- Partially Successful
  |
  |-- Top
  |     |-- Method
  |     |     |-- Cyclomatic complexity number
  |     |     `-- Number of source lines
  |     |-- Package
  |     |     |-- Cycles
  |     |     `-- Distance from the main sequence
  |     |-- Class
  |     |     |-- Afferent coupling
  |     |     |-- Couplage between objects
  |     |     |-- Depth of inheritance tree
  |     |     |-- Lack of cohesion in methods
  |     |     |-- Response for a class
  |     |     |-- Number of methods
  |     |     `-- Sum of all cyclomatic complexity
  |     |-- Summary of pratices
  |     `-- Scatterplott
  |
  |-- Projects
  |     |-- 1st project of the application
  |     |-- 2nd project of the application
  |     `-- ...
  |
  `-- Trend
In the cartridge you will find :
By default Squale compare the mark of the last successful audit with the mark of the next to last successful audit. The dates shown here correspond to the dates of the two audits compared. To change the two audits compared see bellow the part : the left menu / Audits
The area 3 displays the results of the audit for the project chosen. The content of this area 3 depends on the choice done in the left menu.
In this area you will find buttons to export in a file (.PDF,.xls). In general this export is a summary of the informations presents in the area 3.
When an audit is partially successful or failed, a link appears between area 2 and 3. By clicking on this link you will obtain a list of the errors happened during the audit.
Now let's see the summary