


In this case we have three tabs in the area 3.
In this tab you will find :
By clicking o, one factor you will obtain in the area 3 a new set of tabs. This new set of tabs contains the detailed results of one factor.
In this tab you will find a list of all the criteria which make up the selected factor.
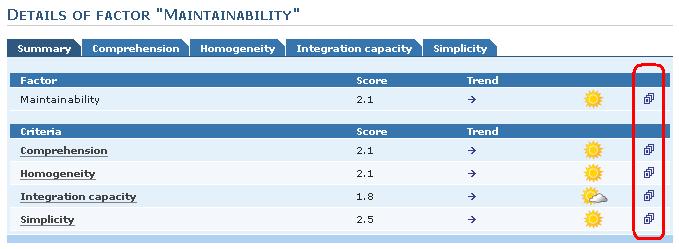
Click on the icon on the right and you will obtain a plot of the score's trend for the corresponding criteria / factor.
By clicking on a criteria you will obtain its corresponding tabs.
In this tabs you will find the list of all the practices which make up the selected criteria.
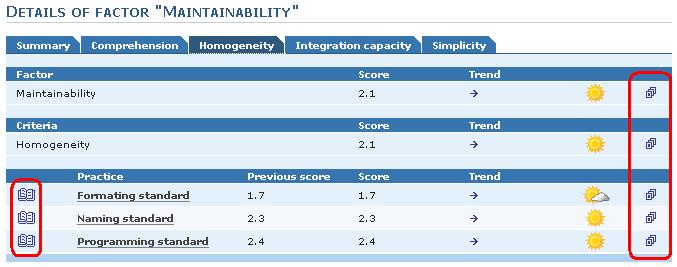
Click on the icon on the right and you will obtain a plot of the score's trend for the corresponding practice / criteria / factor.
Click on the icon on the left and you will obtain a summary on the calculation of the corresponding practice.
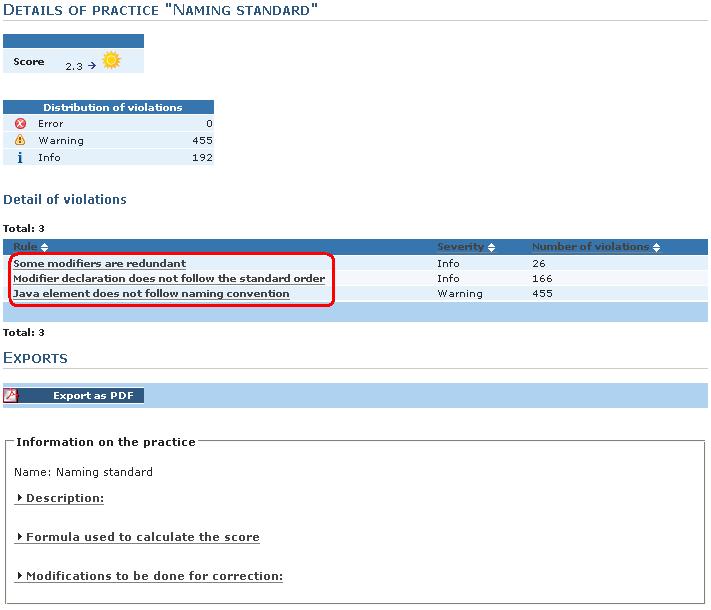
By clicking on a practice you will obtain the detail of this practice in the area 3.
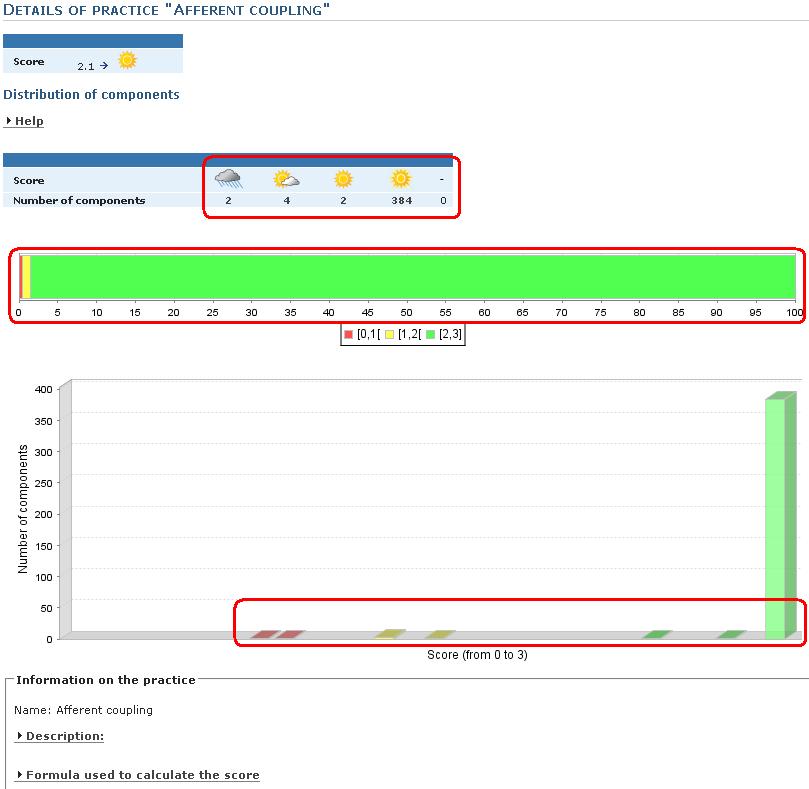
You can have two types of presentation for the results of a practice. The presentation obtain depends of the type of practice :
In this page you have the list of the rule transgress order by criticity level. Click on one rule and you will obtain the list of the places where the selected transgression happened.
In this page you have some representations of the repartition of the score. Click on an interval, you will obtain the list of the components of the project which score is in this interval. By clicking on one of these components you obtain a summary of the results on this component. More details on this new informations here.
In this tab you will find a kiviat graph which contains a plot for the selected project
In this tab you will find Some global informations on the project :
In addition to the classic summary button, you will find three others buttons :
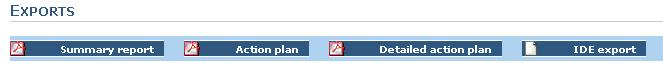
These file give you informations in order to improve your results.
Now let's see the components