
In the area 3 you will obtain the list of the components and their score for the practice chosen sorted in descending order.
Click on one of the components and you will obtain a summary of the results for this component. See here for more informations on this summary
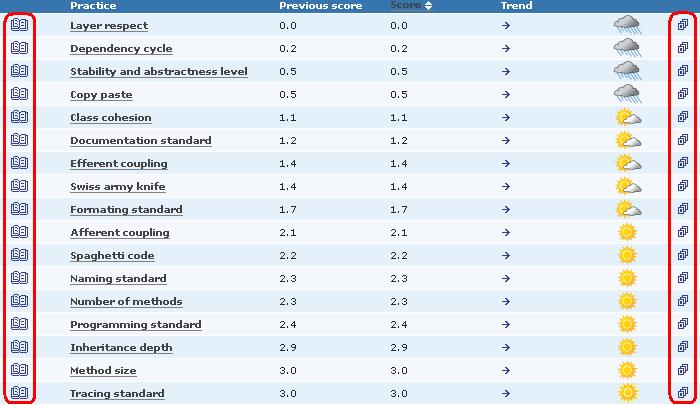
In the area 3 you will find a summary of all the practices calculated, sorted by ascending order of score.

Click on one of the practice and you will obtain the details on the results for this practice.
Click on the icon on the right and you will obtain a plot of the score's trend for the related practice.
Click on the icon on the left and you will obtain a summary of the practice's calculation.
The scatterplott is drawn in the area 3
Now let's see the project